Homework 5
Showing data with D3
Due Date: Jun 03
HW5 Turn-in: Submission Form
Getting started
1. Accept the HW5 assignment
- Follow this link, where HW5 is stored on GitHub Classroom.
- Accept the homework and download the starter code as you did in previous homework.
- Note: in this homework you will be graded not only according to the requirements but also the milestones you are able to complete!
Overall appearance
The overall appearance is the same as the previous homework. However, you will add two graphs using the D3 library to show the time spent grouped by genre. You are completly free to change anything regarding colors, style, positions and design.
Milestone 1
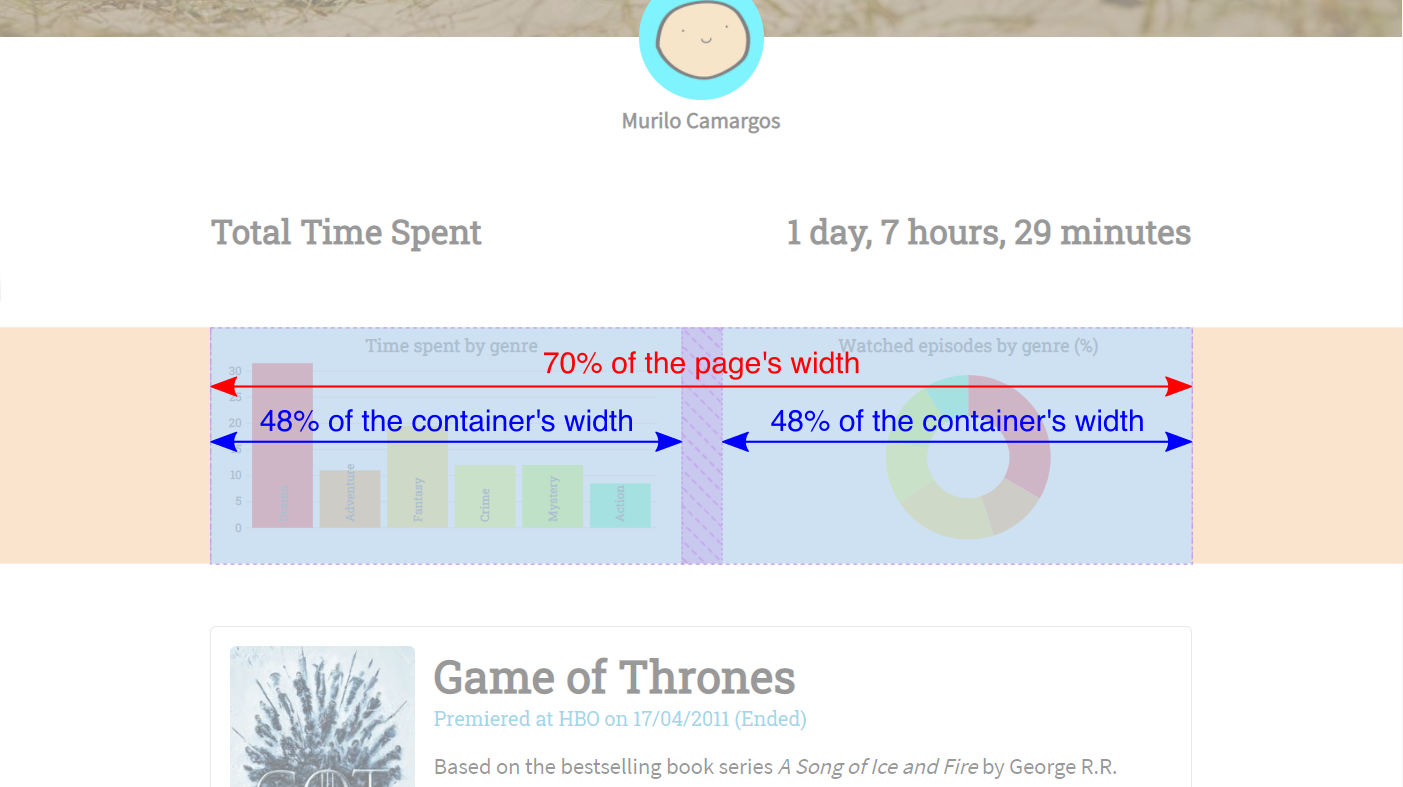
The first milestone of this homework consists in creating two SVG graphs between the Time Keeper and the Show list. The graph container must occupy 70% of the page’s width while each SVG figure will ocupy 48% of the container’s width.
Hint: use the viewBox property to be able to automatically resize your image without losing information.
Milestone 2
The second milestone is to create the bar chart that accounts for the total time spent grouped by genre.
- You must print the genre names
- It is not required that the bars are ordered
- You must implement the interactive behavior to display the total time spent for each genre when the user hovers the mouse over the bars:
Milestone 3
The third milestone is to create the donut chart that accounts for the relative time spent grouped by genre.
- You must implement the interactive behavior to display the relative time spent for each genre when the user hovers the mouse over the arcs:
Milestone 4
The last milestone will require you to update both graphs upon data change: episodes checked by users.
Submit
Upload your completed homework to your GitHub repository and publish them, in the same way that you did before.


